
Note: This article was originally posted on August 28, 2018, and was updated on April 19, 2026
Practitioner’s Preface
Measuring body fat percentage provides a clearer picture of body composition than tracking weight on a scale, and common tools like impedance measurements are affected by hydration status
DEXA scans (Dual Energy X-ray Absorptiometry) are intended to measure bone mineral density, but they also provide an accurate estimate of body fat percentage; however, not everyone wants to, or can, go for this kind of testing to determine how much body fat they have. While most gyms and many pharmacies often have handheld impedance body fat analyzers, these can be affected greatly by changes in body water status, as can high-tech digital bathroom scales that have body fat analyzers built in.
The specific location of stored body fat provides essential clinical data regarding cardiovascular and metabolic health outcomes. Evaluating fat distribution rather than relying solely on height and weight charts allows for a more accurate assessment of chronic disease risk.
In my almost 18 years of private clinical practice, most people who come to see me seeking weight loss are looking for a specific “number” on the scale, usually related to a BMI chart they saw. While BMI has some useful applications, knowing what percentage of a person’s weight is fat is more relevant, and the location of that fat on their body provides important information related to risk factors for metabolic and cardiovascular disease.
Why Is BMI Unreliable for Identifying Obesity?
Body Mass Index (BMI) often misclassifies body composition by failing to separate lean muscle from adipose tissue (fat mass). Clinical studies have demonstrated that standard height and weight equations miss a significant portion of individuals who meet the criteria for obesity.
BMI, calculated as weight divided by height squared, is the standard assessment to categorize people as normal weight, overweight, or obese; however, it is limited because it often misclassifies people’s actual body fat levels. For example,
- According to the US Third National Health and Nutrition Examination Survey, BMI is only 94% accurate for women and 82% accurate for men when it comes to correctly identifying clinical obesity. [1].
- Using a BMI of 30 as the marker for obesity misses nearly 50% of women who actually have a body fat percentage over 35%. [1]
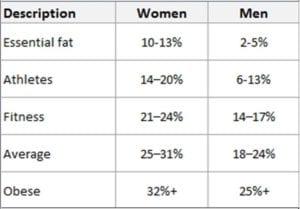
The body fat percentage chart below from the American Council on Exercise (ACE) is commonly used by trainers and gyms to determine body fat percentage, but it is limited as it is based solely on BMI.
Do Body Measurements Indicate Fat Percentage?
Traditional formulas based on physical body measurements require complex equations and multiple skin-fold caliper sites. This lack of simplicity limits practical use in routine medical environments, creating a clear need for a more direct tracking option.
There are several equations based on body measurements (anthropometrics) that have been proposed as alternatives to BMI to better estimate whole body fat percentage. Some require more than 10 different measurements, others require up to 4 different skin-fold measurements using calipers, and even others are complex equations using multiple measurements.
The common problem with all of these equations is a lack of simplicity, limiting their use in routine dietetic or medical practice.
How Does the Relative Fat Mass Equation Estimate Body Fat?
The Relative Fat Mass formula calculates whole body composition using a simple linear equation based on height and waist measurements. Research demonstrates that this straightforward method provides a highly accurate alternative to traditional BMI across diverse demographic populations.
A study published in 2018 [1] systematically explored more than 350 anthropometric measurements to identify that the Relative Fat Mass equation is more accurate than BMI at estimating whole body fat percentage in both men and women.
The Relative Fat Mass (RFM) equation is amazingly simple:
Relative Fat Mass (RFM): 64 − (20 × (height/waist)) + (12 × sex), where sex = 0 for men and 1 for women [1]
Looking at the equations another way, and in both metric and American measurements;
Relative Fat Mass (RFM):
Men: 64 — (20 x height/waist circumference) [1]
Women: 76 — (20 x height/waist circumference) [1]
NOTE: Click here for an article on how to accurately measure your waist circumference for use in this equation.
Compared with BMI, the Relative Fat Mass (RFM) equation was;
- more accurate for body fat-defined obesity among both men and women over 20 years old [1]
- more accurate than BMI for those with a high body fat percentage [1]
- This accuracy held for those who were Mexican-Americans, European Americans, and African-Americans [1].
How is Health Status Reflected in Relative Fat Mass Scores?
Relative fat mass classifications group individuals into clear categories ranging from healthy to obese based on clinical thresholds. Interpreting these values helps identify whether fat levels fall within safe ranges or pose elevated metabolic risks to long-term health.
Based on the research of Gallagher et al [2] and data from the World Health Organization, healthy body fat ranges have been determined as follows:
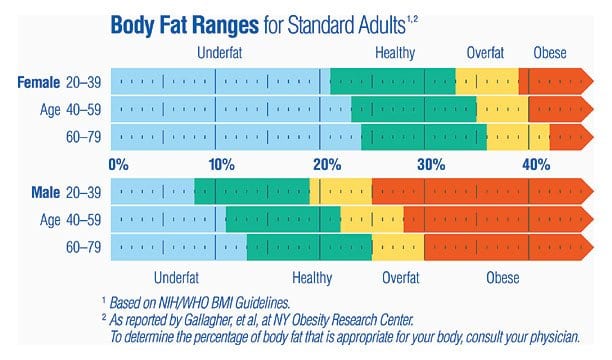
- In the case of Example 1, the 41-year-old male with an RFM of 32.2 would be considered at the low end of “obese”.
- The 60-year-old female of Example 2 with an RFM of 38.9 would be classified at the low end of “overfat”.
- The 50-year-old female of Example 3 with an RFM of 33.4 would be classified at the higher end of the “healthy” range.
What is the Link Between Relative Fat Mass and All-Cause Mortality?
Current clinical studies establish clear cutoff values that link elevated Relative Fat Mass (RFM) directly with all-cause mortality. New data highlight that RFM is an essential clinical indicator capable of predicting long-term risks for cardiovascular issues and diabetes-related complications.
There have been several major updates to the Relative Fat Mass (RFM) research, including a 2020 paper by the original authors, Woolcott and Bergman [3].
While the 2018 paper focused on estimating fat percentage, the 2020 paper established specific RFM cutoffs to diagnose obesity based on the association between RFM and all-cause mortality.
The researchers found that BMI significantly underestimates the prevalence of obesity in the U.S., particularly among women and older adults. The authors suggest that RFM cutoffs of 40% for women and 30% for men be used to diagnose obesity and identify individuals at higher risk of death [3].
- Obesity for Men: RFM ≥ 30%
- Obesity for Women: RFM ≥ 40%
Furthermore, the researchers highlighted that while BMI misses nearly 50% of women with obesity [1], the 2020 study showed that RFM correctly identified those same individuals with over 90% accuracy.
Woolcott also published a major update in December 2024 [4] that demonstrated that Relative Fat Mass (RFM) is a superior predictor of mortality compared to both Body Mass Index (BMI) and traditional waist circumference, as it predicts death from diabetes-related complications.
The study found that individuals with high RFM scores have a significantly higher risk of dying from diabetes-related complications and heart disease, establishing RFM not just as a tool for estimating body fat, but as a critical clinical marker for predicting metabolic outcomes such as diabetes and heart disease [4].
How Relative Fat Mass Shifts Focus Away from Weight?
Practitioners utilize Relative Fat Mass to shift the clinical focus away from weight, as measured by a scale, toward actual tissue composition. Highlighting the percentage of fat mass helps people understand the actual physiological health risk and helps motivate lifestyle changes.
Part of what I do when I work with people is to help them sort out significant data from what they think is important data. Initially, their weight (as a number) is often of greatest concern, but they come to understand that the amount of fat that is represented in that weight, as represented by Relative Fat Mass, should be the focus.
Does Managing Relative Fat Mass Lower Chronic Disease Risk?
Managing body composition by tracking Relative Fat Mass provides a pathway to lower the risk of chronic conditions like hypertension and heart disease. Utilizing this simple calculation enables early clinical intervention to support sustainable health upgrades.
Obesity is a significant risk factor for multiple chronic diseases and conditions, including diabetes, coronary artery disease, hypertension (high blood pressure), and certain types of cancer [1,4]. Relative Fat Mass (RFM) is a very simple equation that accurately estimates whole-body fat percentage, as well as the risk of dying from diabetes or heart disease.
The use of Relative Fat Mass (RFM) enables clinicians such as myself to help people understand their risk while supporting the dietary and lifestyle changes needed to reduce it.
More Info
Dietitians can provide structured, evidence-based guidance for tracking body composition and improving long-term metabolic health indicators. Personalized dietary support helps individuals implement sustainable lifestyle adjustments to successfully reduce chronic disease risks.
If you would like more information about how I can help, you can learn about me and the Comprehensive Dietary Package that I offer.
To your good health!
Joy
You can follow me on:
Twitter: https://twitter.com/jyerdile
Facebook: https://www.facebook.com/BetterByDesignNutrition/
Quick Clinical Summary of Relative Fat Mass
Evaluating body composition using height and waist ratios offers a highly reliable method for predicting health outcomes. Shifting focus away from standard weight metrics toward accurate fat mass evaluation allows for better tracking of metabolic progress.
Q: What is Relative Fat Mass (RFM) and how is it calculated?
A: Relative Fat Mass (RFM) is a formula used to estimate body fat percentage using only height and waist circumference. For men, the formula is 64 − (20 × height/waist); for women, it is 76 − (20 × height/waist).
Q: Why is RFM considered more accurate than BMI?
A: Unlike BMI, which only measures weight relative to height, RFM specifically uses waist circumference to account for abdominal fat. Research shows it more accurately matches results from DXA scans, the gold standard for body composition.
References
- Woolcott OO, Bergman RN. Relative fat mass (RFM) as a new estimator of whole-body fat percentage: a cross-sectional study in American adult individuals, Scientific Reports; Volume 8, Article number: 10980 (2018), https://www.nature.com/articles/s41598-018-29362-1
- Gallagher, D. et al. Healthy percentage body fat ranges: an approach for developing guidelines based on body mass index. Am J Clin Nutr 72, 694—701 (2000).
- Woolcott, O. O., & Bergman, R. N. (2020). Defining cutoffs to diagnose obesity using the relative fat mass (RFM): Association with mortality in NHANES 1999–2014. International Journal of Obesity, 44(6), 1301–1310. doi: 10.1038/s41366-019-0516-8
- Woolcott, O.O., Samarasundera, E., & Heath, A.K. Association of relative fat mass (RFM) index with diabetes-related mortality and heart disease mortality. Sci Rep 14, 30823 (2024). https://doi.org/10.1038/s41598-024-81497-6


I am a Registered Dietitian Nutritionist and the owner of BetterByDesign Nutrition Ltd. With a postgraduate degree in Human Nutrition and a background as a published mental health nutrition researcher, I have been dedicated to supporting my clients’ clinical needs since 2008.
I hold active professional licenses in BC (CHPBC), Alberta (CDA), and Ontario (CDO), allowing me to provide regulated Medical Nutrition Therapy across these provinces. My expertise spans chronic disease management, complex digestive health, and therapeutic diets. I am deeply passionate about helping people reclaim their health, rooted in my firm belief that Nutrition is BetterByDesign©.