Introduction
Since 1977, the dietary recommendations in Canada and the US have been for people to consume a diet with limited fat and where ”complex carbohydrates” (starches) comprise the main source of calories. Unfortunately, this has not been without consequence when it comes to rates of child and adult overweight and obesity, and Type 2 Diabetes.
Canada’s Food Guide 1947-1977
From 1949 until 1977, the dietary recommendations of Canada’s Food Guide were for people to consume
~20-30% of their daily calories as carbohydrate
~40-50% of daily calories as fat
~20-30% of daily calories as protein
From 1977 onward, Canada’s Food Guide recommended that people consume:
55-60% of daily calories as carbohydrate
<30% of daily calories as fat, with no more than 1/3 from saturated fat
15-20% of daily calories as protein
2007 Canada’s Food Guide
The US recommendations since 1977 have been similar to those in Canada, with the Dietary Goals for the United States recommending that carbohydrates are 55-60% of daily calories and that calories from fat be no more than 30% of daily calories (of which no more than 1/3 comes from saturated fat).
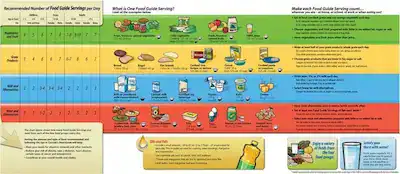
Currently, we are using Eating Well with Canada’s Food Guide, which came out in 2007, and which recommends that people eat even more of their daily calories as carbohydrates.
45-65% of daily calories as carbohydrate
20-35% of daily calories as fat, with no more than 1/3 from saturated fat
10-35% of daily calories as protein
[Reference: http://www.hc-sc.gc.ca/fn-an/nutrition/reference/table/ref_macronutr_tbl-eng.php]
Health Canada recommends limiting fat to only 20-35% of calories while eating 45-65% of daily calories as carbohydrates, and currently advises adults to eat only 30-45 mL (2 — 3 Tbsp) of unsaturated fat per day (including that used in cooking, salad dressing, and spreads such as margarine and mayonnaise).
This is what people have come to call a ”balanced diet”.
But is it?
The Effect of Eating a “Balanced Diet”
For the past 40 years, the public has come to believe that eating fat makes you fat’ and that eating saturated fat causes heart disease. This, however, is not what evidence-based research shows.
Our society has become ”fat phobic”. People guzzle skim or 1% milk with little regard to the fact that just 1 cup (250 ml) has almost the same amount of carbs as a slice of bread. And who drinks only one cup of milk at a time? Most people’s ”juice glasses” are 8 oz, and the glasses they drink milk from are 16 oz, which is 2 cups. Whoever stops to think of their glass of milk as having the same amount of carbs as almost 2 slices of bread?
In addition, carbs are hidden in the 7-10 servings of Vegetables and Fruit they are recommended to eat, with no distinction made between starchy and non-starchy vegetables. Many people eat most of their vegetable servings as carbohydrate-laden starchy vegetables such as peas, corn, potatoes, and sweet potatoes and then have a token serving of non-starchy vegetables (like salad greens, asparagus or broccoli) on the ”side” at dinner. Who stops to think that just a 1/2 cup serving of peas or corn has as many carbs as a slice of bread — and often those vegetables are eaten with a cup of potatoes, adding the equivalent number of carbs as another 2 slices of bread?
People drink fruit juice and ”smoothies” with no regard for all of the extra carbs they are consuming (not to mention the effect that all of that fructose has). A ”small juice glass” is 8 oz, so just a glass of orange juice has the equivalent number of carbs as another 2 slices of bread! Many grab a smoothie at lunch or for coffee break without even thinking that the average smoothie has the same number of carbs as 5 slices of bread!
Then there is the toast, bagels, and cereal or bars that people eat for breakfast, the sandwiches or wraps they eat for lunch, and the pasta or rice they have for supper. These are carbs people know as carbs — which are added to all the carbs they consume as vegetables, fruit, and milk.
What has been the outcome of people following these dietary recommendations to eat a high-carb diet since 1977?
Obesity Rates
In 1977, obesity rates* were 7.6% for men and 11.7% for women, with the combined rate of < 10 % for both genders.
* Obesity is defined as a Body Mass Index (BMI) 30 kg/(m)2
In 1970-72, the obesity rate in Canadian adults was 10%, and by 2009-2011, it increased two and a half times, to 26%.
In 1970-72, only 7.6% of men were obese, but by 2013, 20.1% of men were categorized as obese. In 1970-72, only 11.7% of women were obese but by 2013, 17.4% of women were obese.
In 1978 in Canada, only 15% of children and adolescents were overweight or obese, yet by 2007, that prevalence almost DOUBLED to 29% of children and adolescents being overweight or obese. By 2011, obesity prevalence alone (excluding overweight prevalence) for boys aged 5- to 17 years was 15.1% and for girls was 8.0%.
Since 1977, the emphasis on consuming diets high in carbohydrates and low in fat has taken its toll.
Effect on Health
Non-alcoholic liver disease is rampant and not surprisingly, considering 37% of adults and 13% of youth are abdominally (or truncally) obese — that is, they are carrying their excess body fat around and in the internal organs, including the liver.
Since the 1970’s, Diabetes rates have almost doubled.
- In the 1970s, the rate of Type 2 Diabetes in women was 2.6% and in men was 3.4 %. In the 1980s, that number rose in women to 3.8% and in men to 4.5%. In the 1990s, the rate was almost double what it was in 1970; in women, it was 4.7%, and in men, 7.5%.
If people eating a high-carb, low-fat diet have corresponded to an increase in obesity, overweight, and Diabetes, it’s time to consider/reconsider the alternatives.
More Info
If you would like more information, you can learn about me here.
To your good health!
Joy
You can follow me on:
Twitter: https://twitter.com/jyerdile
Facebook: https://www.facebook.com/BetterByDesignNutrition/
Copyright ©2017 BetterByDesign Nutrition Ltd. LEGAL NOTICE: The contents of this blog, including text, images and cited statistics as well as all other material contained here (the ”content”) are for information purposes only. The content is not intended to be a substitute for professional advice, medical diagnosis and/or treatment and is not suitable for self-administration without regular monitoring by a Registered Dietitian and with the knowledge of your physician. Do not disregard medical advice and always consult your physician with any questions you may have regarding a medical condition or before implementing something you have read in our content.

I am a Registered Dietitian Nutritionist and the owner of BetterByDesign Nutrition Ltd. With a postgraduate degree in Human Nutrition and a background as a published mental health nutrition researcher, I have been dedicated to supporting my clients’ clinical needs since 2008.
I hold active professional licenses in BC (CHPBC), Alberta (CDA), and Ontario (CDO), allowing me to provide regulated Medical Nutrition Therapy across these provinces. My expertise spans chronic disease management, complex digestive health, and therapeutic diets. I am deeply passionate about helping people reclaim their health, rooted in my firm belief that Nutrition is BetterByDesign©.